More visual explanation
![]()
More visual explanation
![]() - The relationship between X and Y would be different if we use multilevel model relative or linear regression.
- The relationship between X and Y would be different if we use multilevel model relative or linear regression.
Nested Data and Cluster Sampling Designs
- Nested data defined as a data that contains one more other structures of the same or different type
- Individual data points at one level (e.g. student) appear in only one level of a higher-level variable such as school.
- Thus, students are nested within school.
- Another example where employees group by division in the company.
Illustration of Nested Structure
![]()
Pitfalls of Ignoring Multilevel Data Structure (1)
When performing multilevel modeling, violations of the assumption of independent errors may occur. For example, the math achievement scores of students who attend the same school will be more correlated than the scores of students who attend different schools.
This may be because students in the same school have the same teachers, curriculum, and community, or for other reasons.
Correlation within schools will result in inaccurate estimates of standard errors for the model parameters, which in turn can lead to statistical inference errors, such as p-values that are smaller than they should be and result in Type 1 errors.
Pitfalls of Ignoring Multilevel Data Structure (2)
- In addition, we may miss important relationships involving each level in the data. As in our example, there are two sampling levels: students (level 1) nested within schools (level 2).
- Specifically, by not including information about schools, for example, we may miss important variables at the school level that help explain students’ math performance.
- In the context of MLM, including variables at each level is relatively straightforward, as are interactions among variables at different levels.
- This greater model complexity can in turn lead to a better understanding of the phenomena being studied.
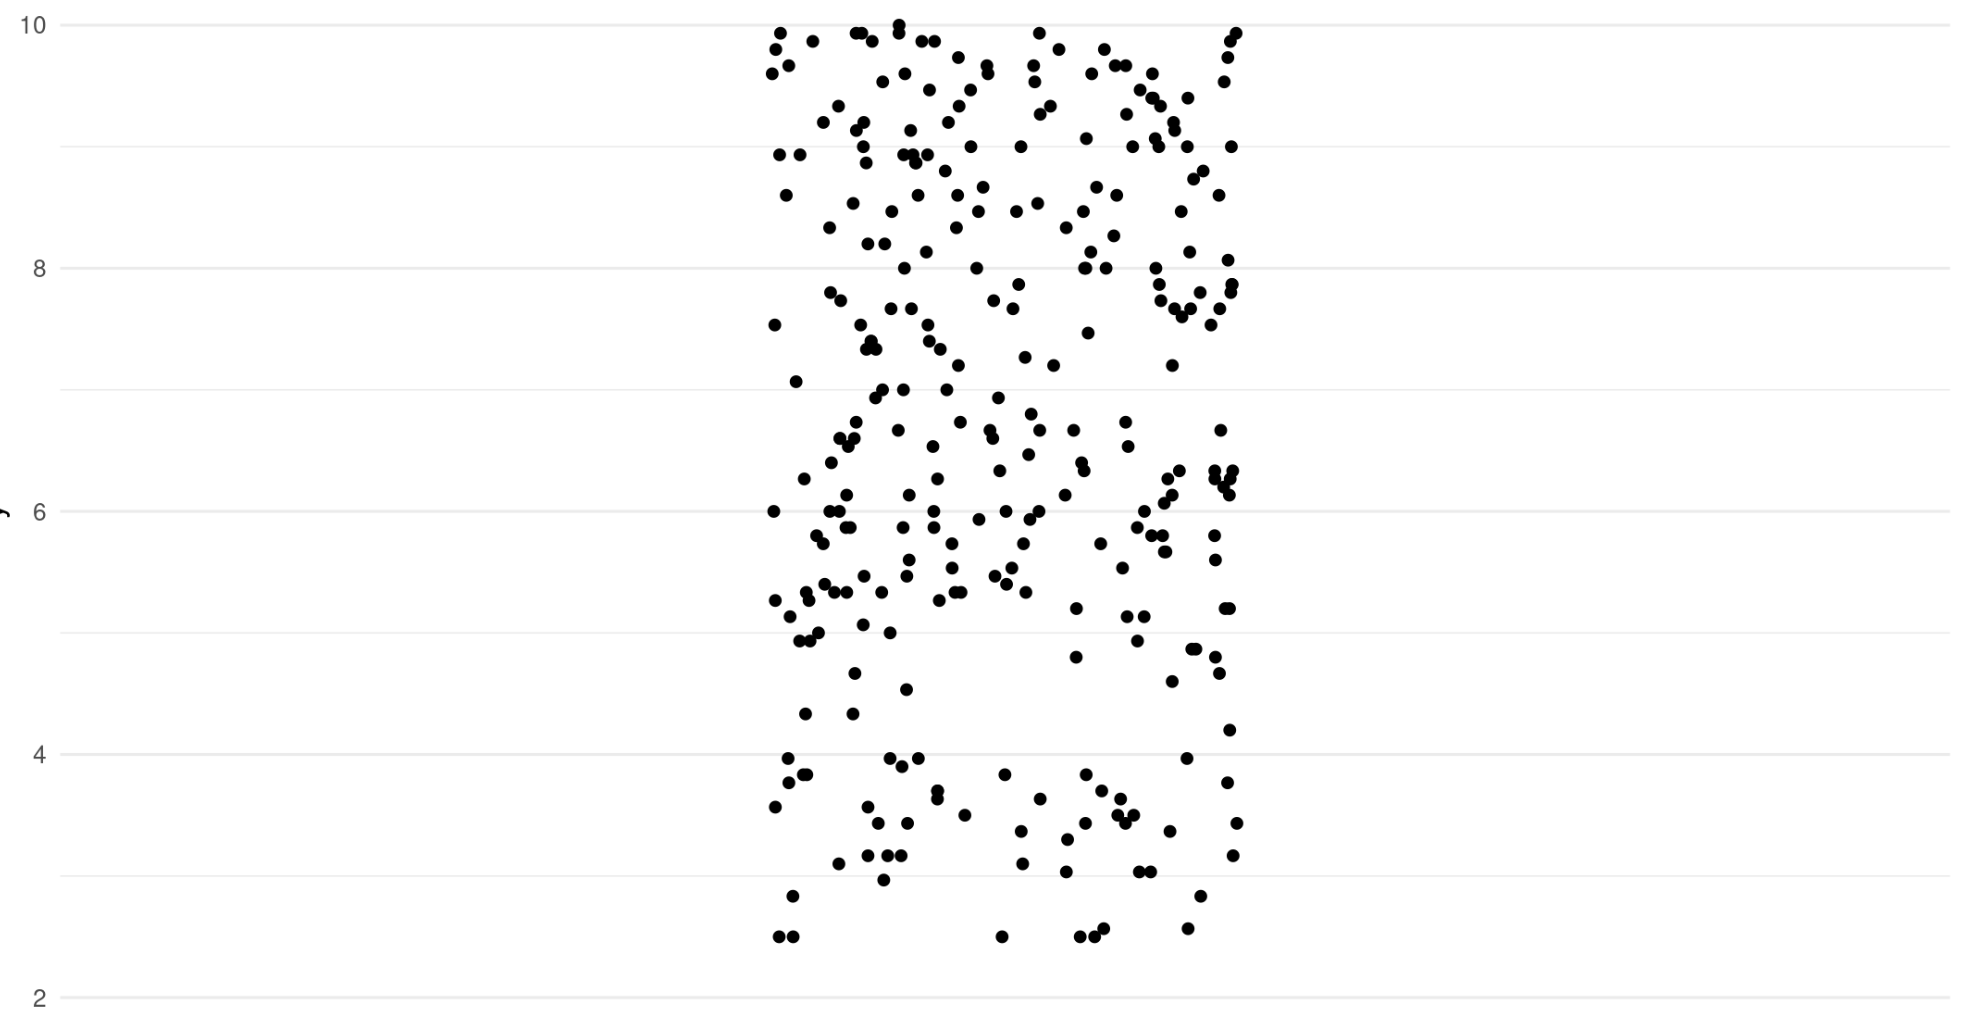
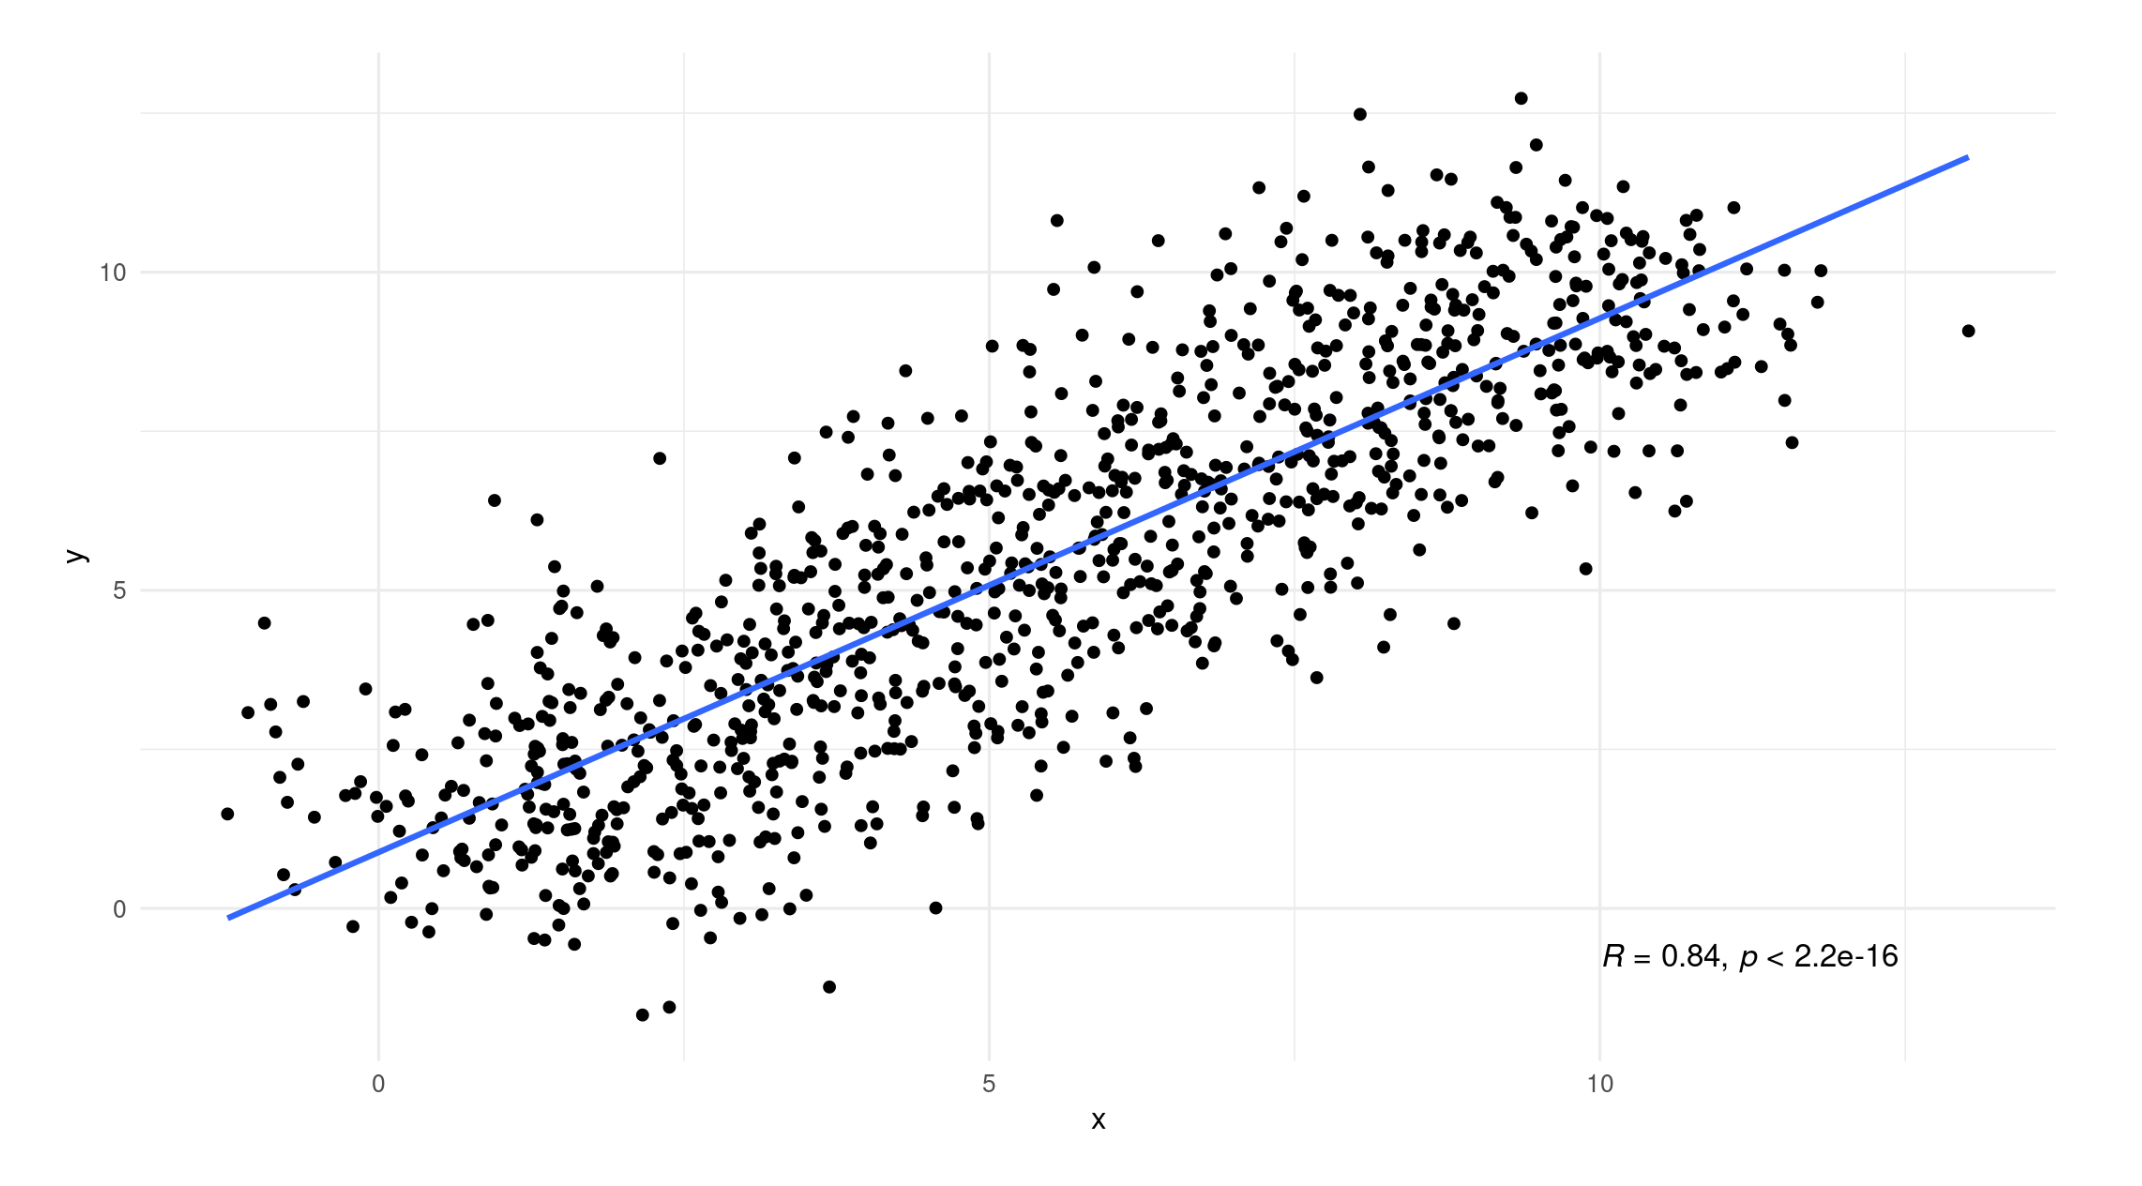
Dataset
Now, we have the same dataset as before.
![]()
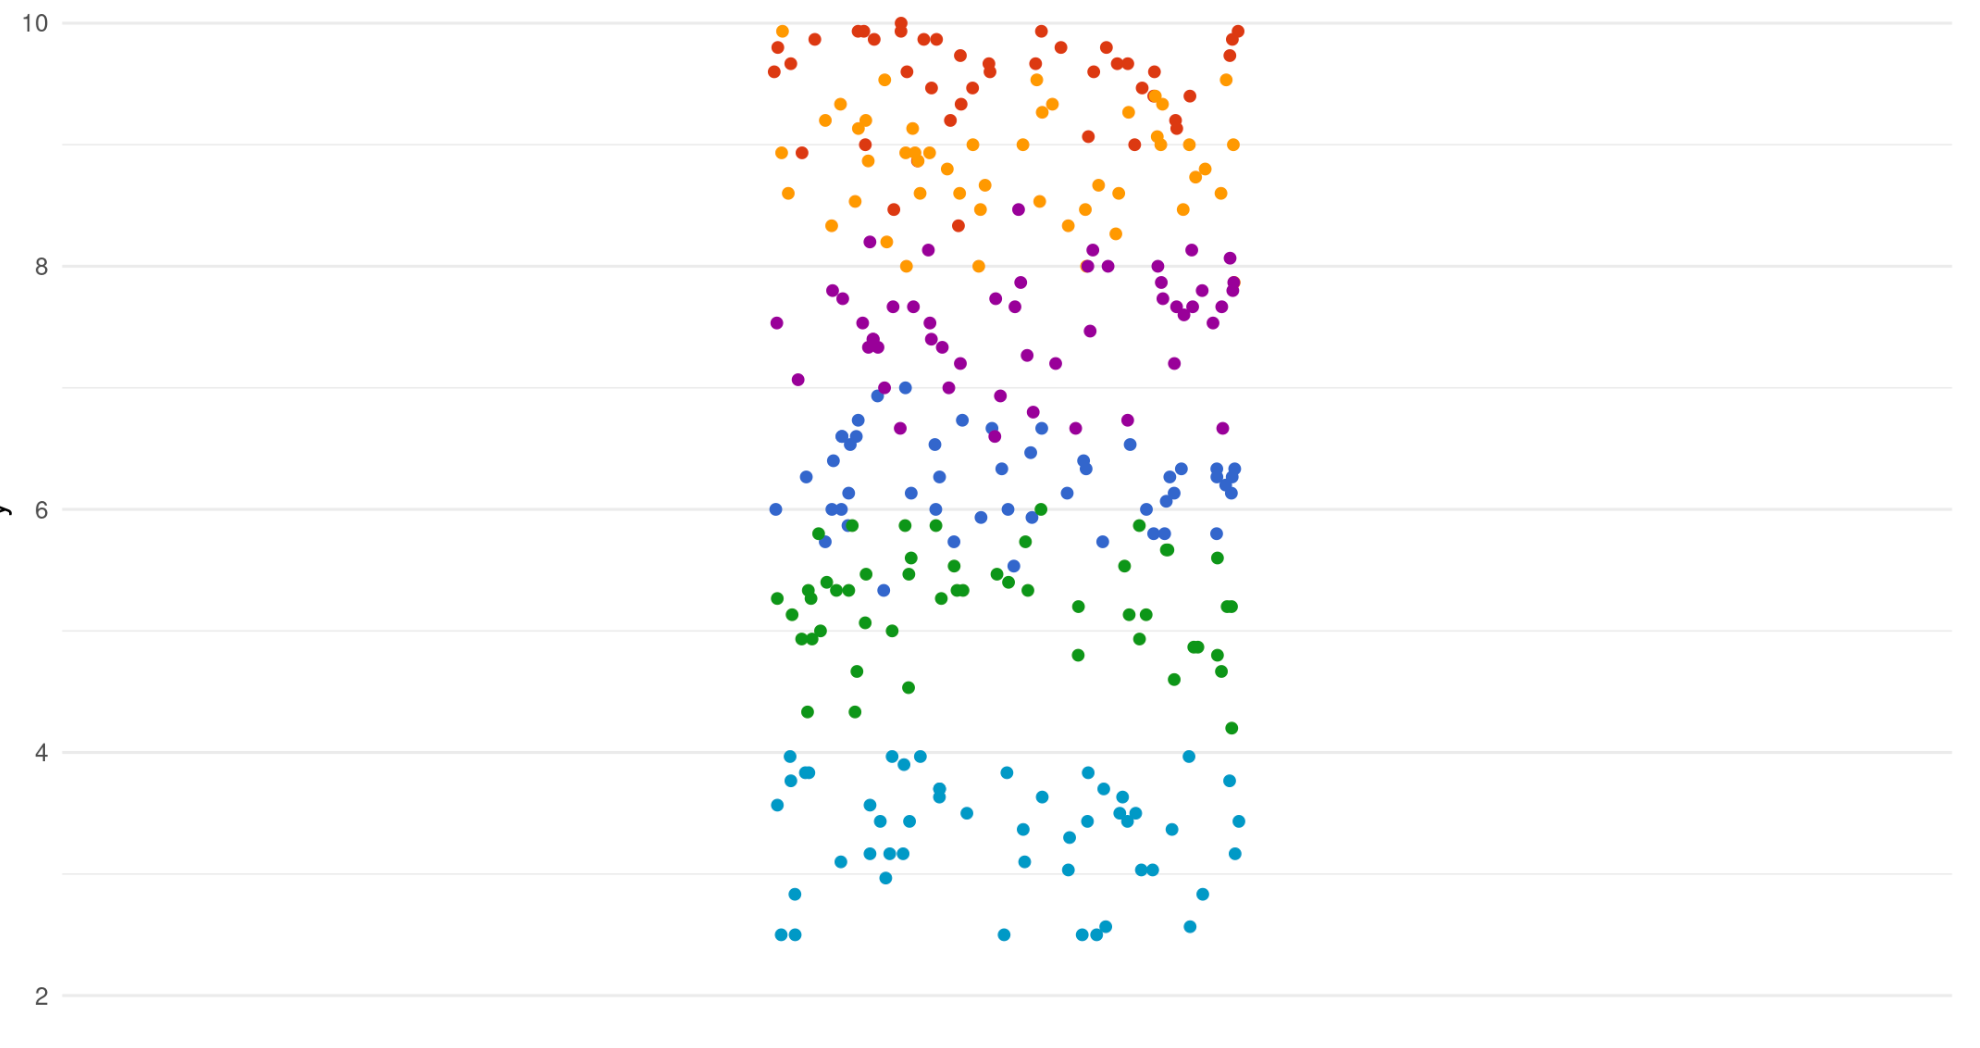
Nested stucture
Now, we have the same dataset as before.
But this time we introduce a multilevel data structure, i.e. our data points are nested in six other groups.
![]()
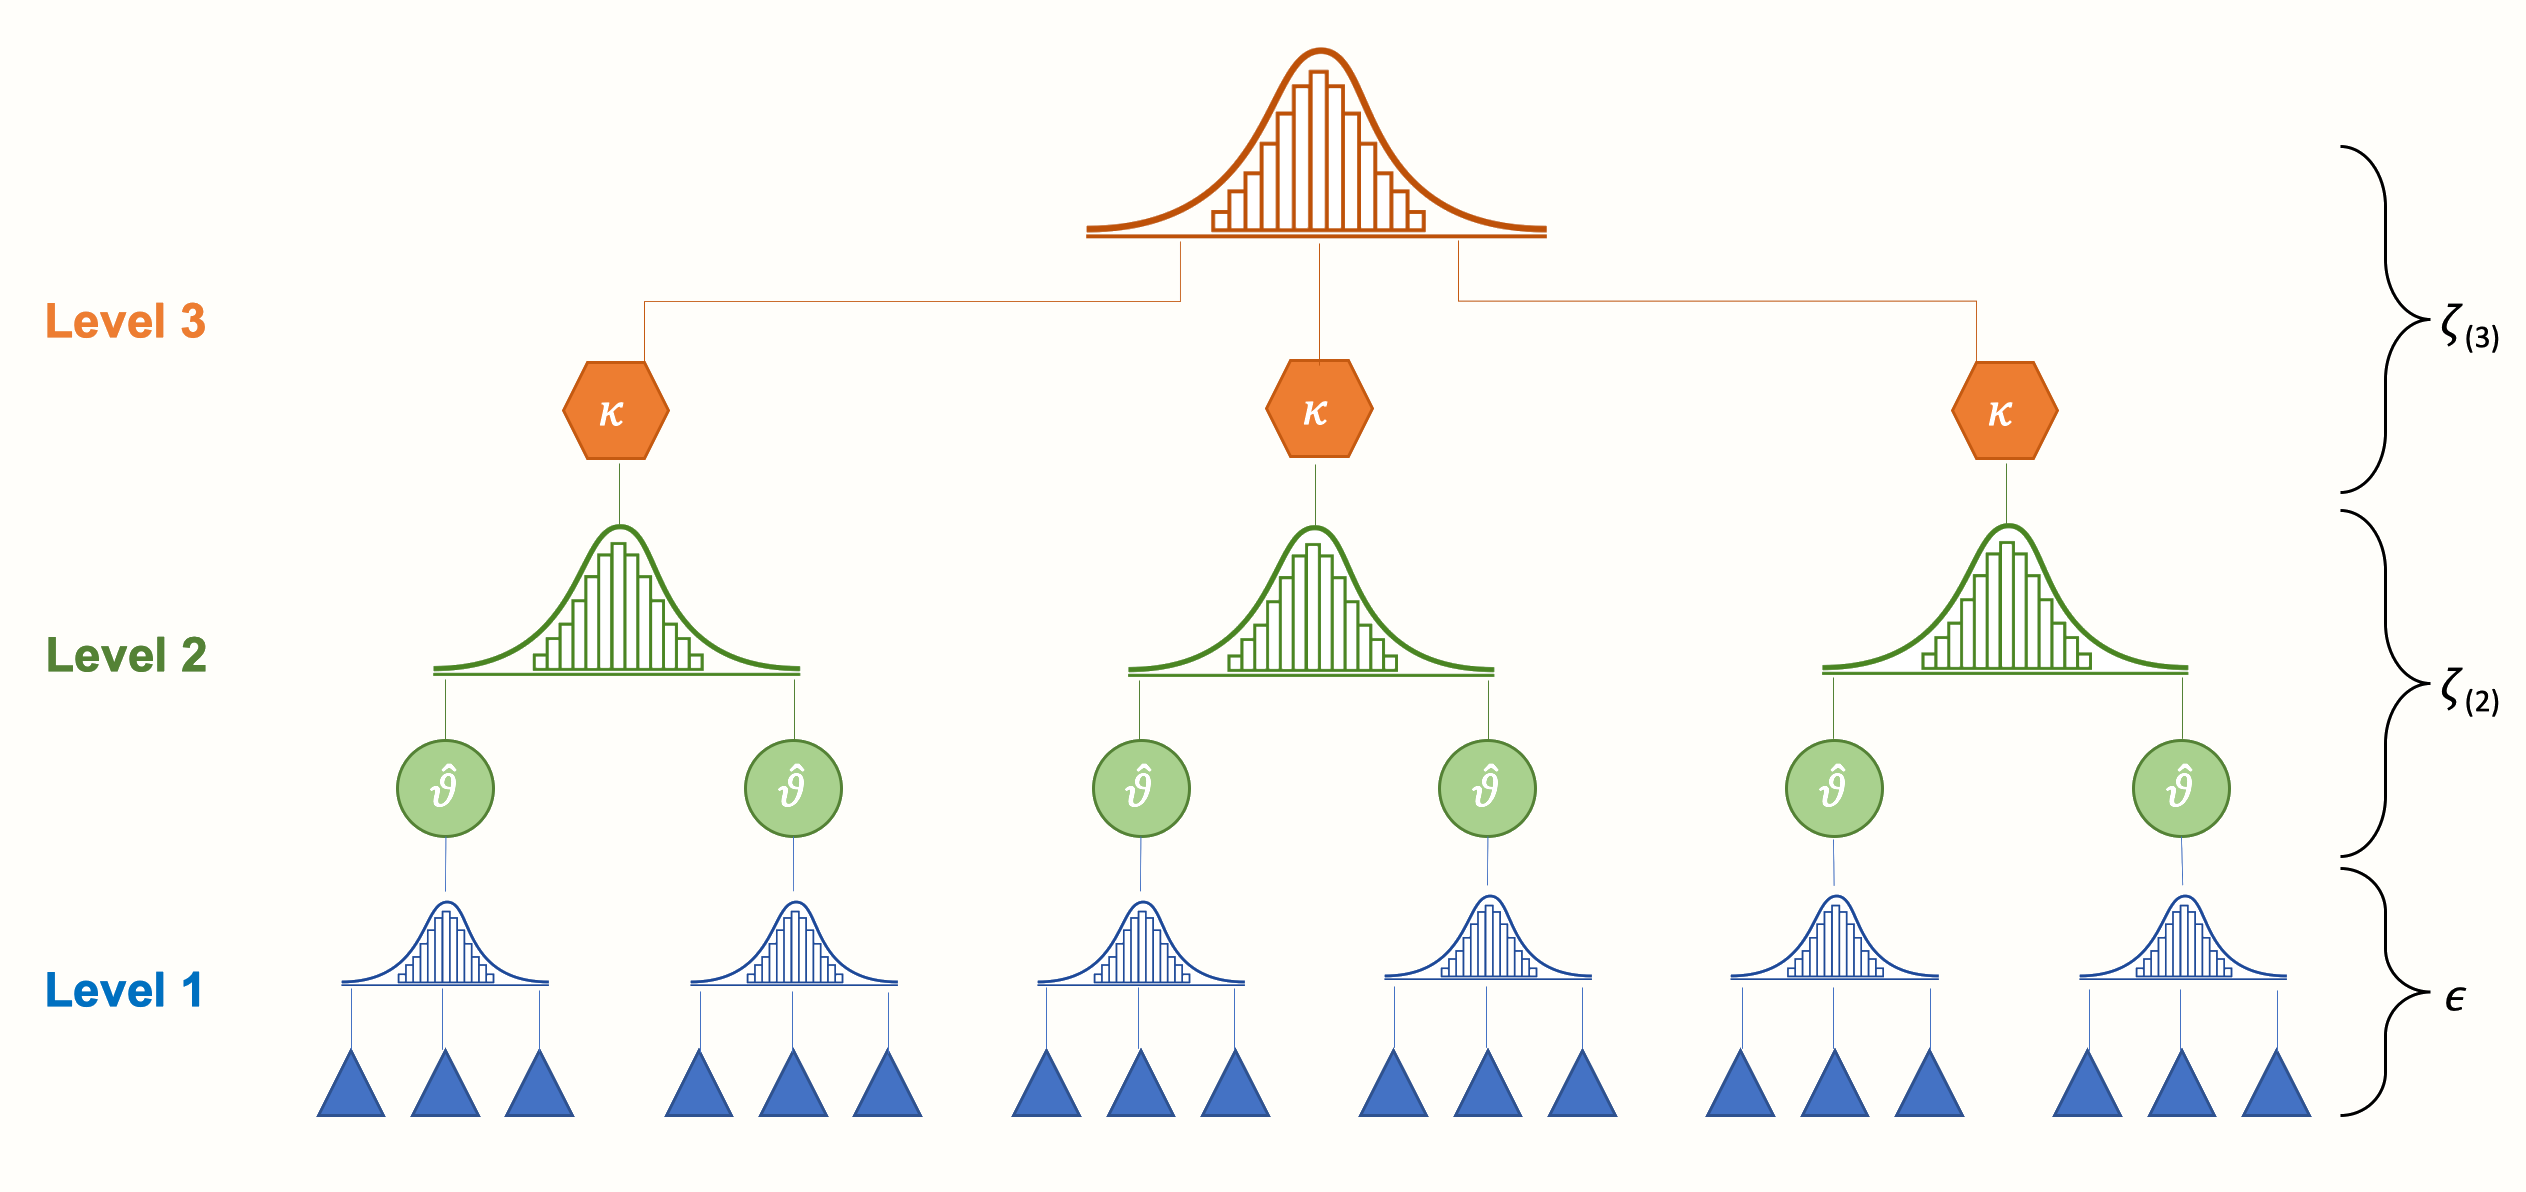
Null model illustration
First, we estimate a null model again.
In a multilevel context this means estimating a random intercept only model, without any predictors.
![]()
Null model specification
In MLM, analysis often begins with a null model, which can be denoted as follows. The null model is used as a basis for model building and as a model comparison.
\[
y_{ij}=\gamma_{00}+U_{0j}+\varepsilon_{ij}
\]
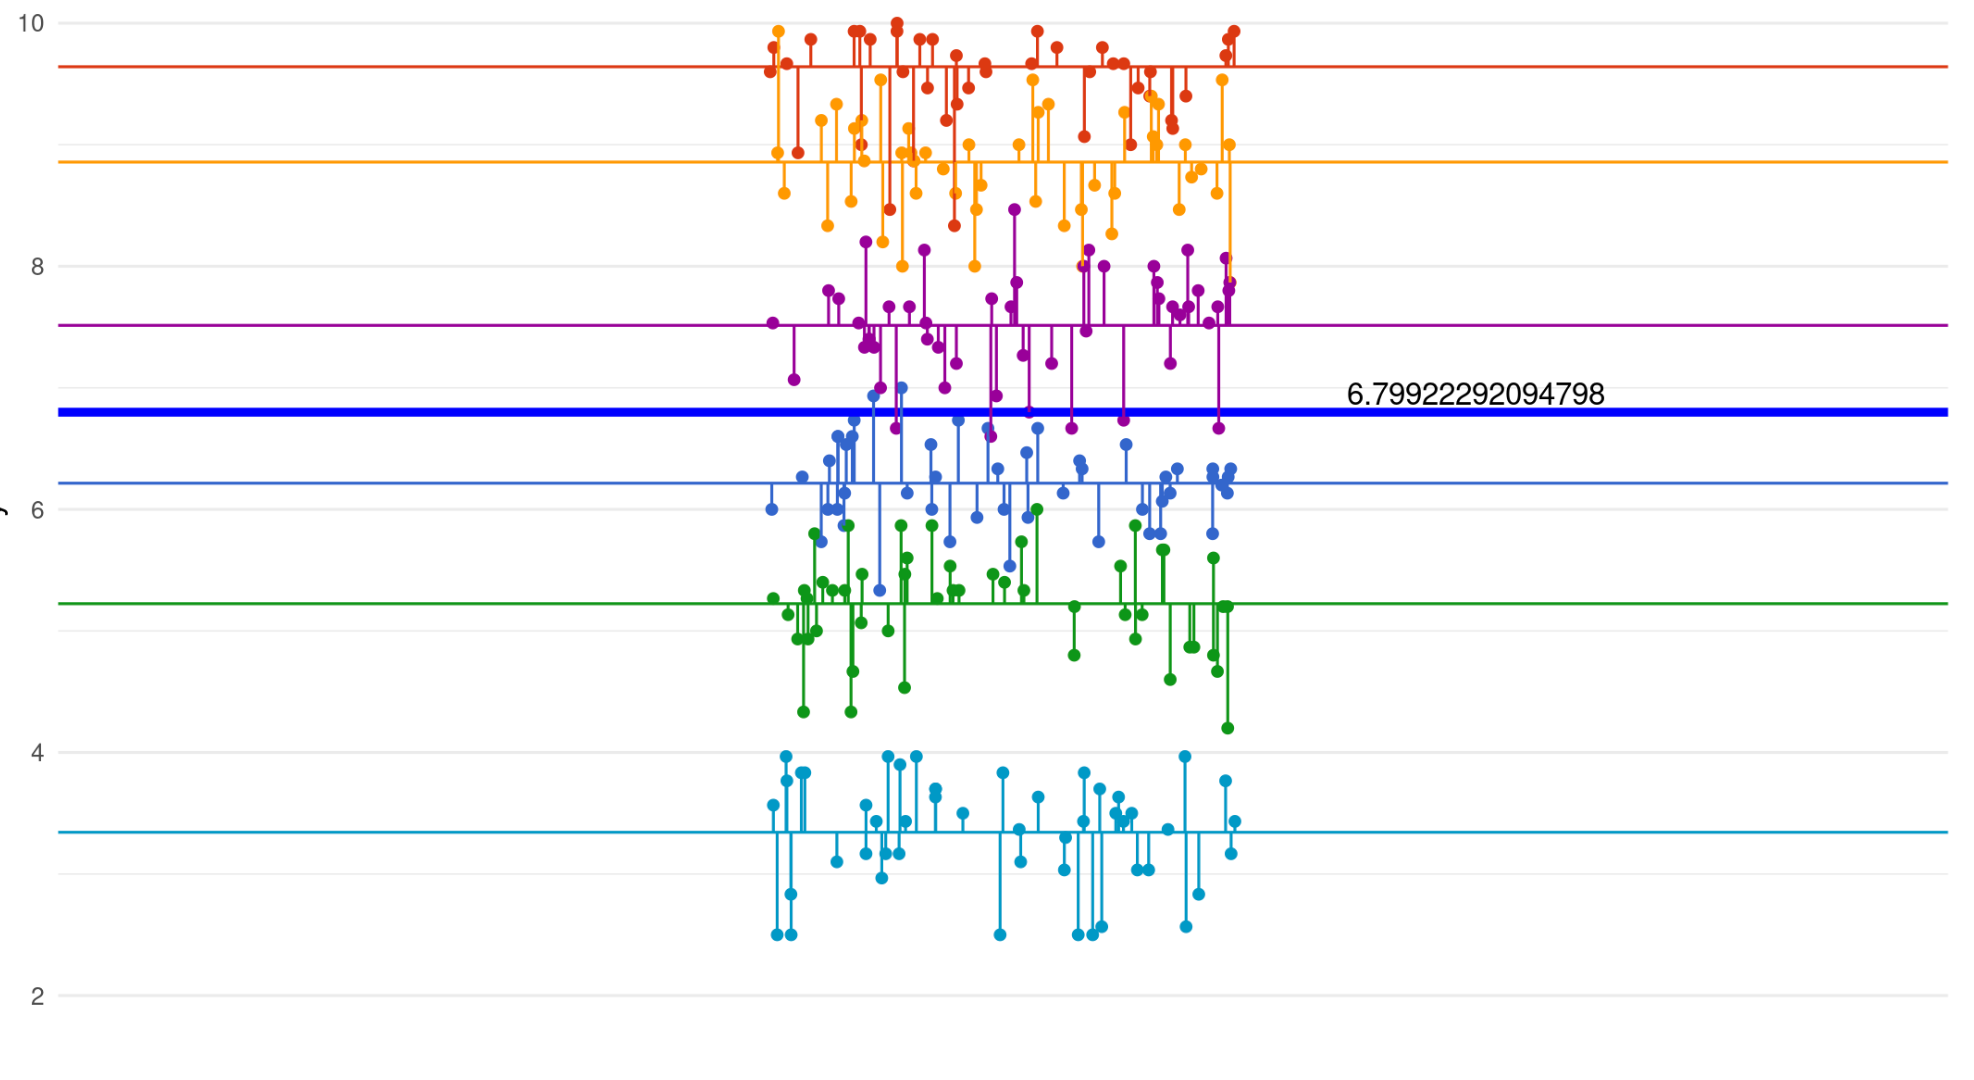
Within group variation
![]()
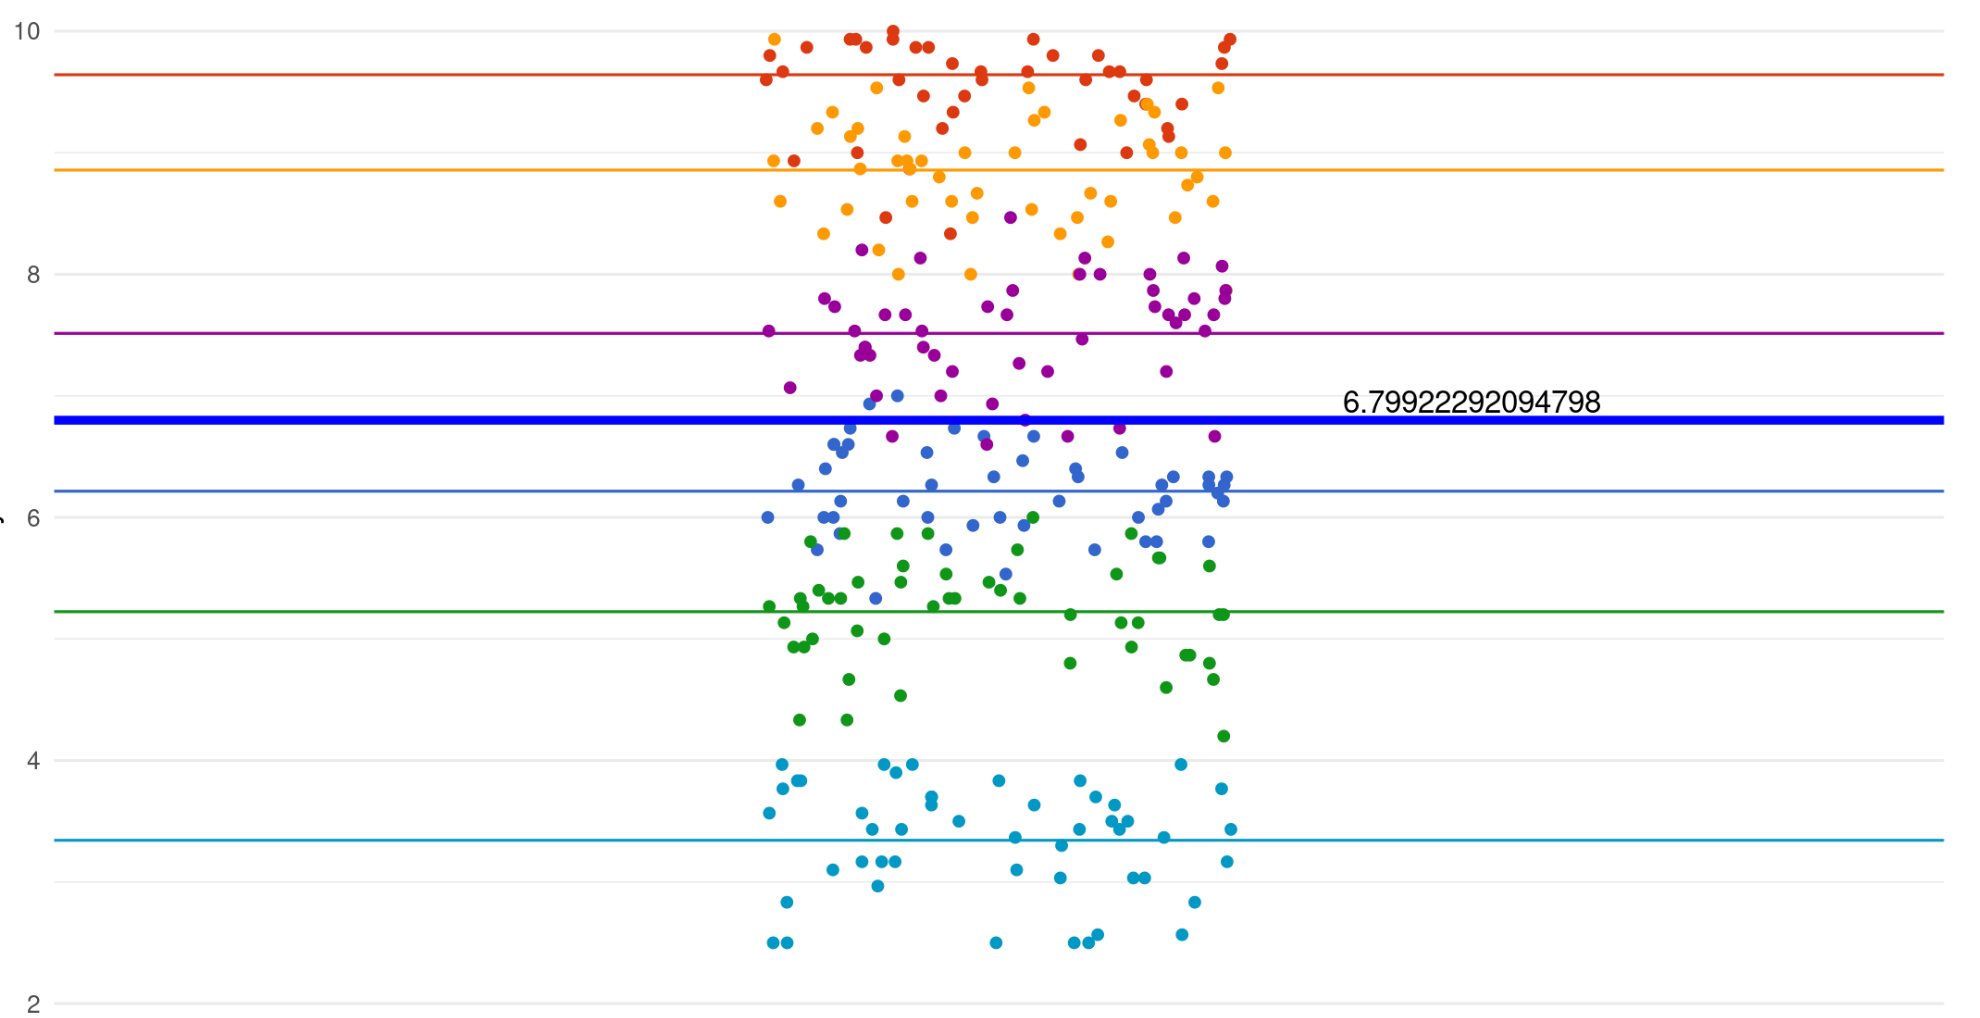
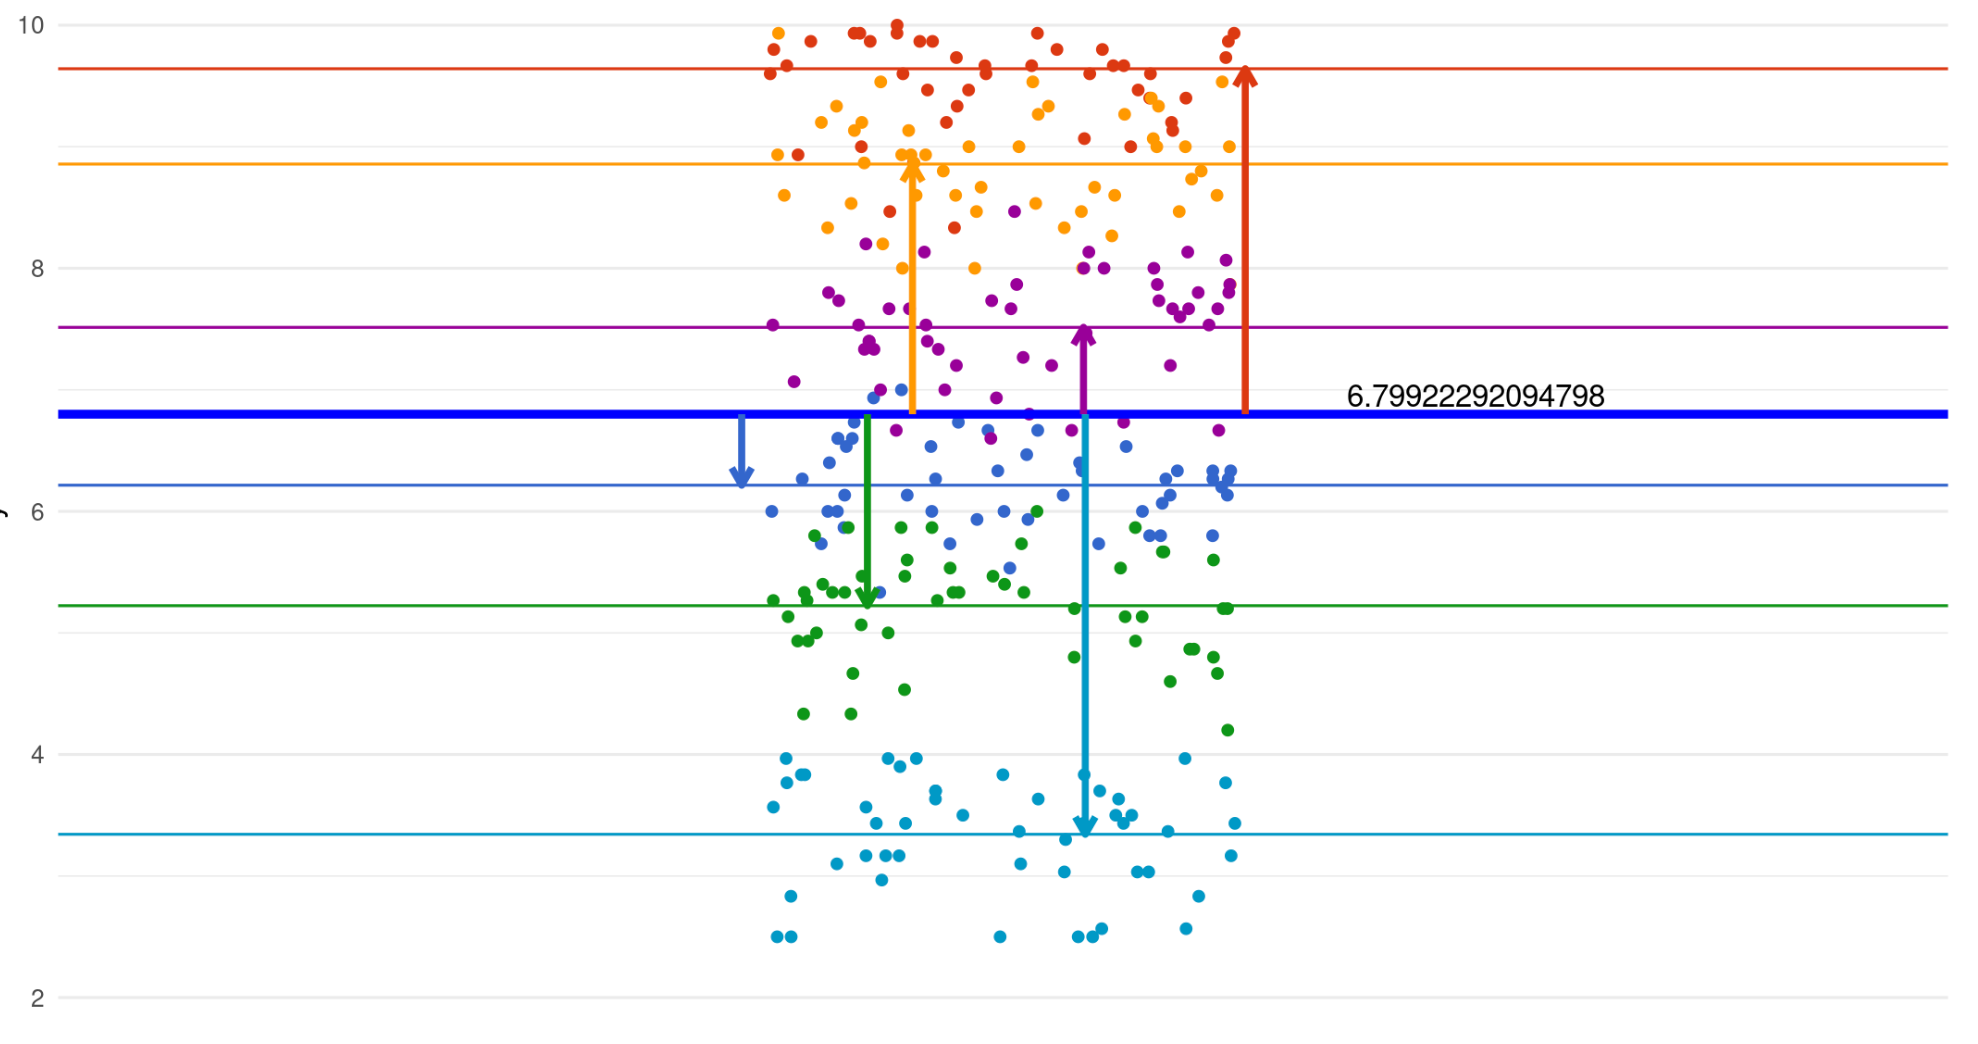
Between group variation
We’ve also introduced an error term for each group intercept, i.e. differences between the grand mean and other group-specific intercepts.
This shows the between-group variation.
![]()
Intraclass Correlation
- Intraclass correlation (ICC) is the ratio of the variance between groups to the total variance denoted by \({\rho}_1\) in the population.
- ICC ranges from 0 (no variance between clusters) to 1 (there is variance between clusters but no variance within clusters). Mathematically, ICC can be formulated as follows. cluster variance).
The Concept of ICC
\(\rho_I\) can also be conceptualized as the correlation for the dependent measure for two individuals randomly selected from the same cluster. It can be expressed as:
\[
\rho_I = \frac {\tau^2}{\tau^2 + \sigma^2}
\]
where \(\tau^2\) = Population variance between clusters \(\sigma^2\) = Population variance within clusters
The Concept of ICC
The ICC is an important tool in multilevel modeling, in large part because it is an indicator of the degree to which the multilevel data structure might impact the outcome variable of interest.
The higher the ICC value, the more diversity there is between groups/clusters.
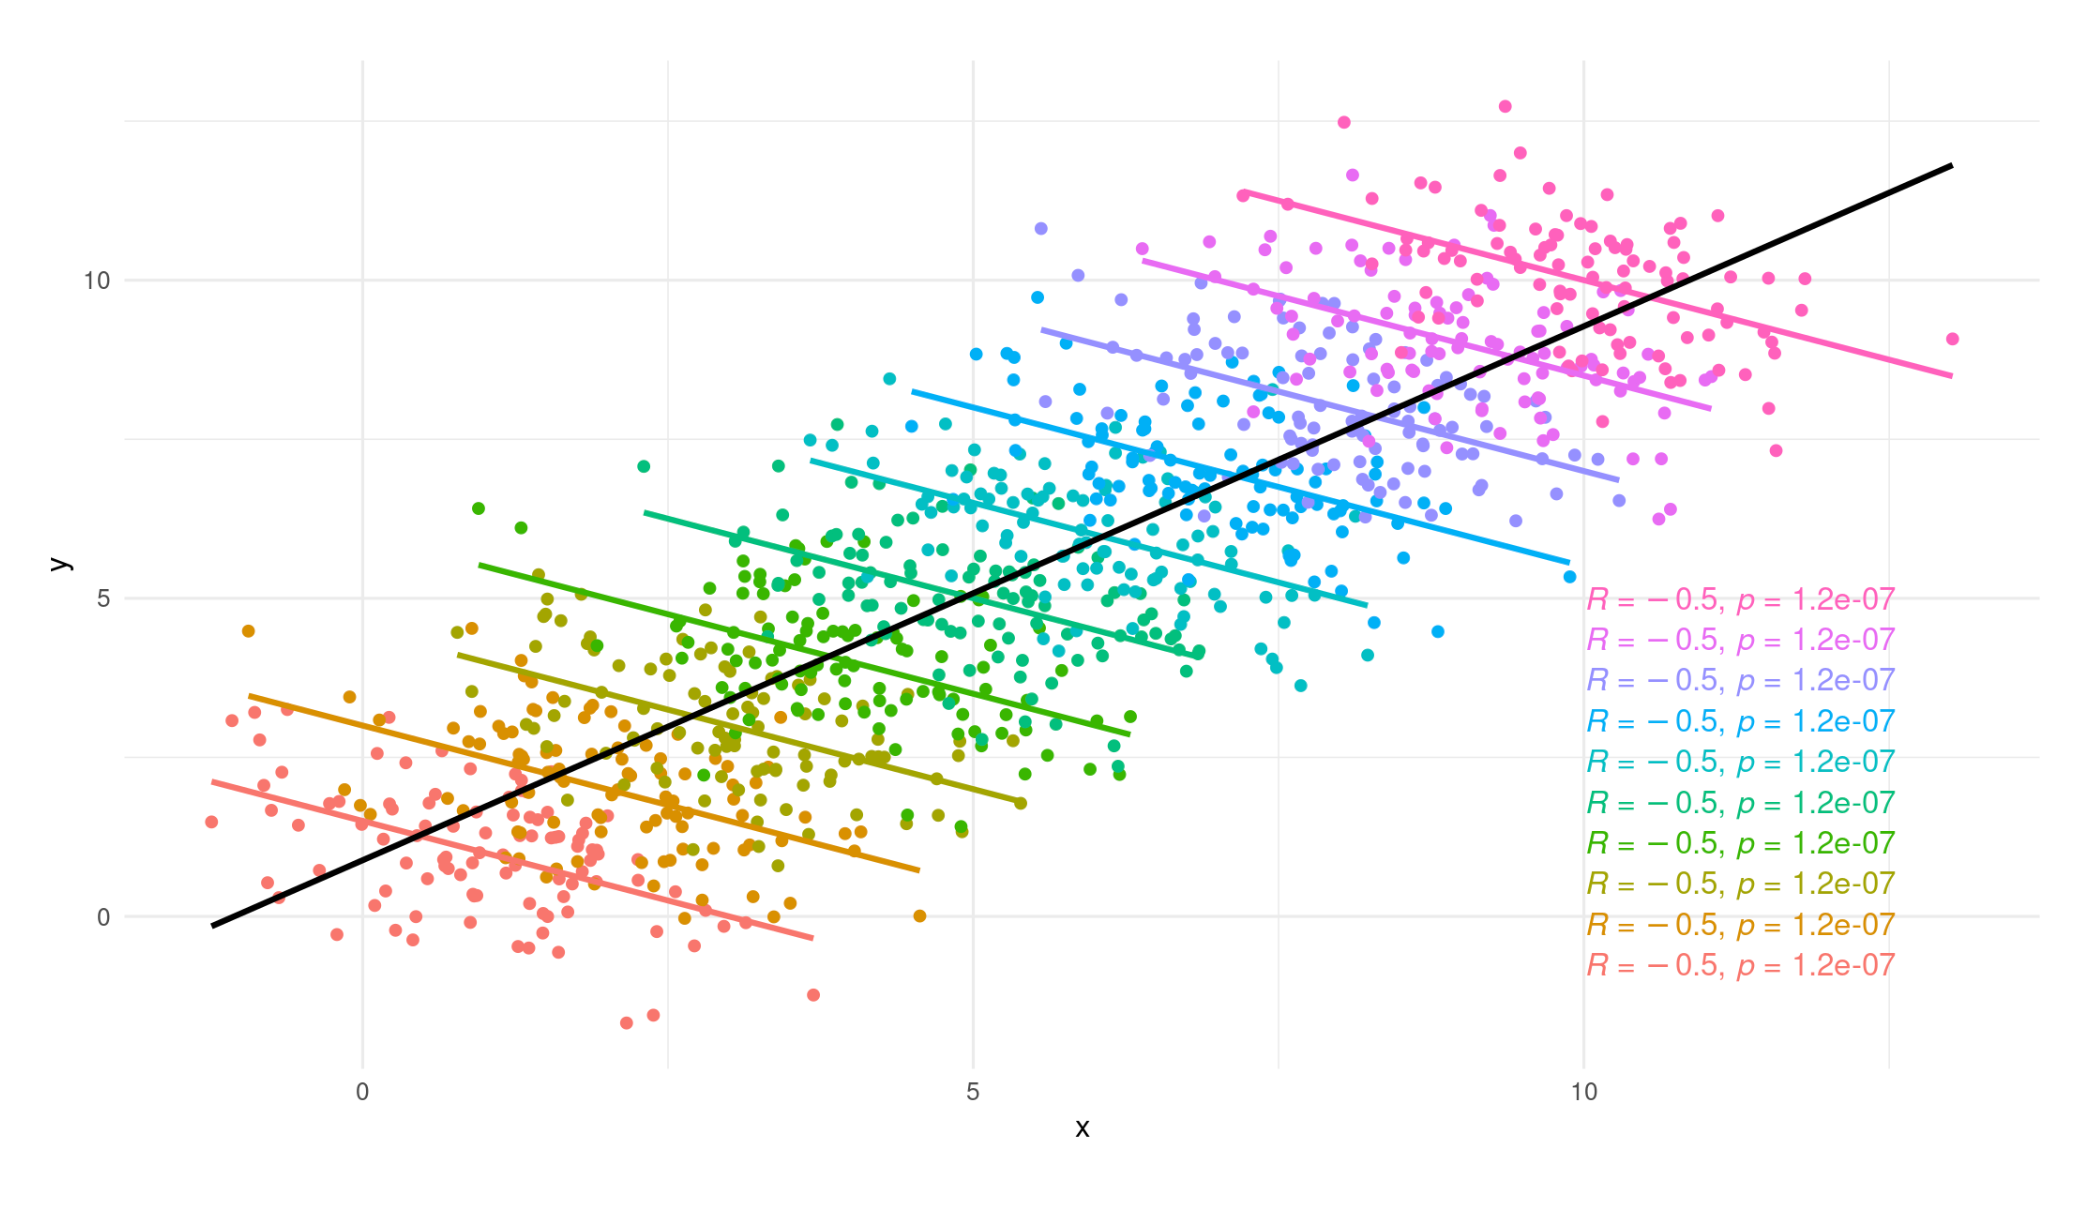 - The relationship between X and Y would be different if we use multilevel model relative or linear regression.