library(tidyverse)ESCS & Achievement per school PISA Indonesia
pisa_idn_sample <- read_csv("dataset/pisa_idn_sample.csv")pisa_idn_2 <- pisa_idn_sample |>
select(CNTSCHID, ESCS, MATH, growth)pisa_idn_2 |>
ggplot(aes(ESCS, MATH, group = CNTSCHID, col = factor(CNTSCHID))) +
geom_point(shape = 16, alpha = 0.5) +
geom_line(stat = "smooth", method = "lm", formula = "y~x", se = F,
alpha = 08, linewidth = 1) +
theme_minimal() +
theme(legend.position = "none")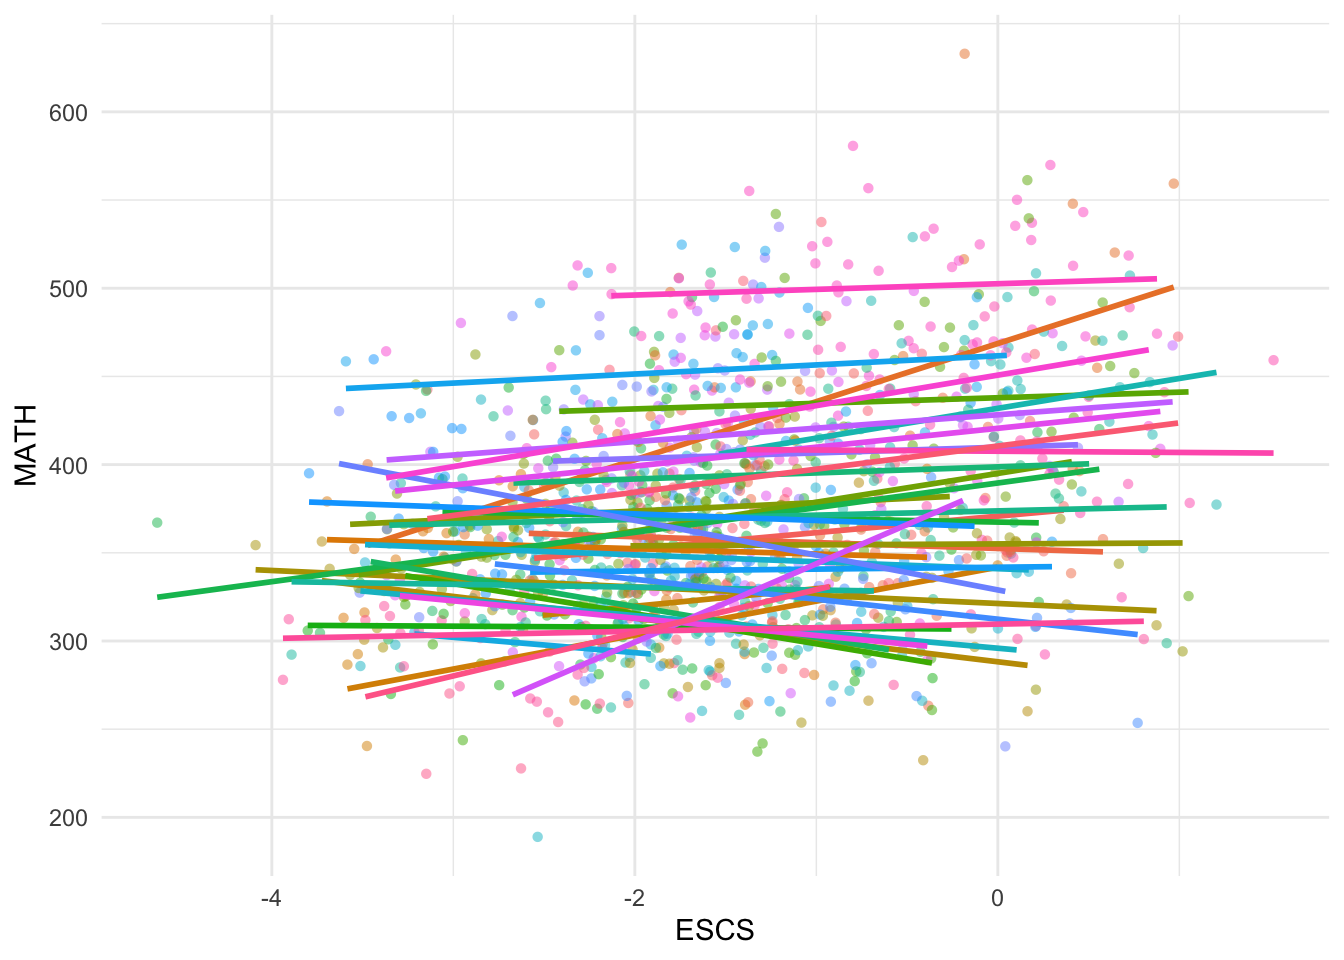
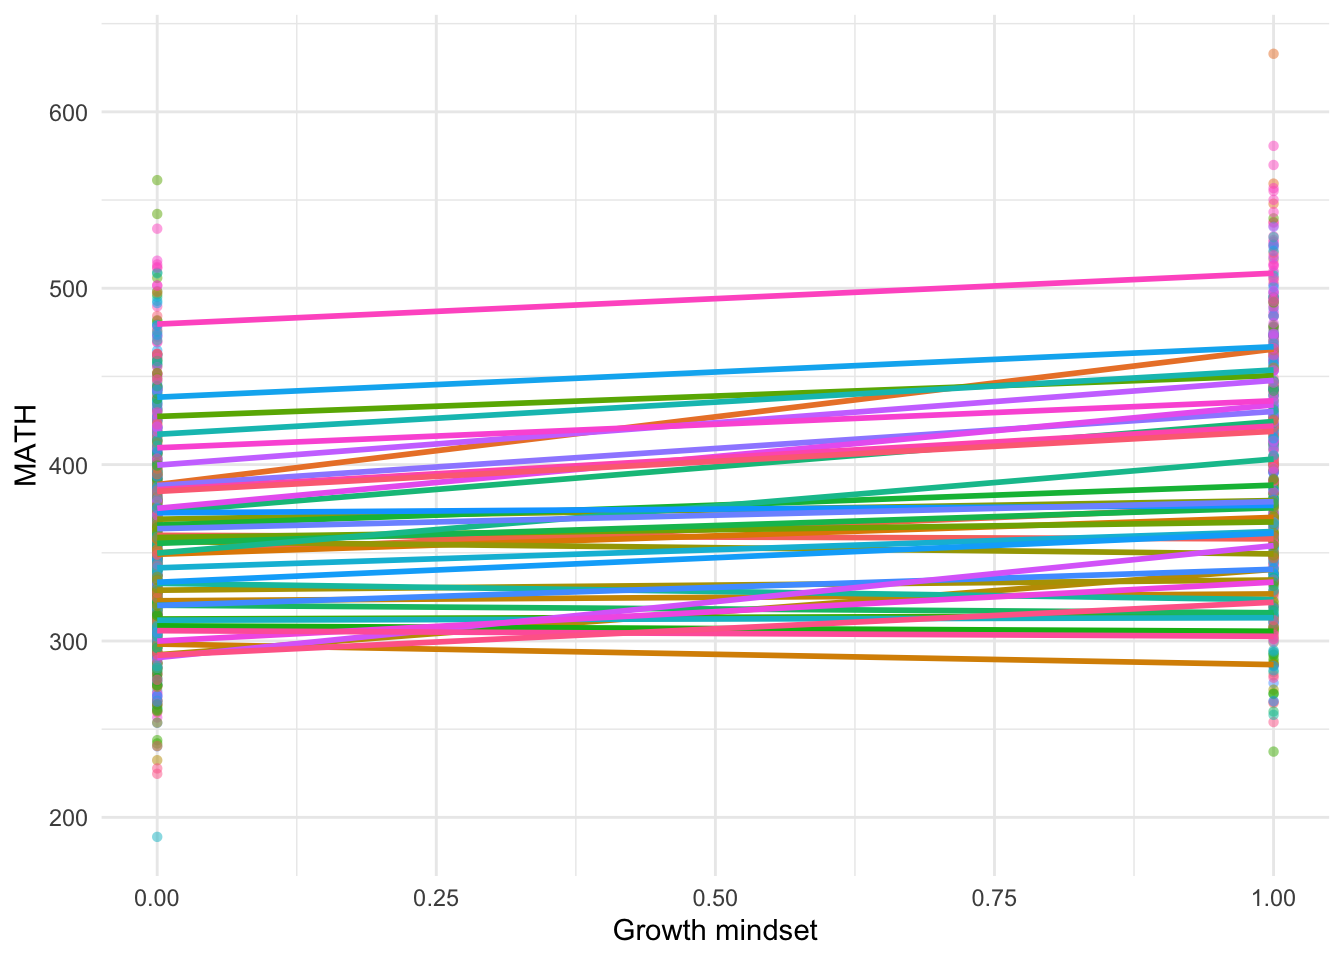
pisa_idn_2 |>
  ggplot(aes(growth, MATH, group = CNTSCHID, col = factor(CNTSCHID))) +
  geom_point(shape = 16, alpha = 0.5) +
  geom_line(stat = "smooth", method = "lm", formula = "y~x", se = F,
            alpha = 08, linewidth = 1) +
  theme_minimal() +
  theme(legend.position = "none") +
  labs(x = "Growth mindset")